Operating cost movements are central to shipping’s fortunes.
Shipping has certainly lived up to its reputation for volatility during the past twelve months. The quarterly Moore Stephens Shipping Confidence Survey showed industry confidence improving for the second successive quarter in the three months to end-August 2016, but this was from its lowest level for eight years.
Familiar Story, a Welcome New Chapter
The industry has been beset by a range of all-too-familiar problems, including depressed freight rates, tonnage overcapacity in many sectors, problematic geopolitical developments and mounting regulation. The good news, however, is that total annual operating costs in the industry fell by an average of 2.4% in 2015. This compares with the 0.8% average fall in costs recorded for 2014, and is the fourth successive overall year-on-year reduction in such costs. All categories of expenditure were down on those for the previous 12-month period. This suggests continued pragmatic management of costs by ship owners and operators.
OpCost 2016, Moore Stephens’ unique ship operating costs benchmarking tool, reveals that total operating costs for the tanker, bulker and container ship sectors were all down in 2015, the financial year covered by the study. On a year-on-year basis, the tanker index was down by 4 points, or 2.2%, while the bulker index fell by 6 points, or 3.6%. The container ship index, meanwhile, was also down by 6 points, or 3.7%.
Line Items: crew costs surprisingly down
There was a 1.2% overall average fall in 2015 crew costs, compared to the 2014 figure, which itself was 0.1% down on 2013. By way of comparison, the 2008 report revealed a 21% increase in this category. Tankers overall experienced a fall in crew costs of 1.3% on average, compared to the 0.4% fall recorded in 2014. All categories of tankers reported a reduction in crew costs for 2015 with the exception of Panamaxes and VLCCs. The most significant reduction in tanker crew costs for 2015 was the 3.6% recorded by Product Tankers.
For bulkers, meanwhile, the overall average fall in crew costs in 2015 was 1.1%. The operators of Handysize Bulkers paid 2.3% more in crew costs than in 2014, but the operators of other categories of bulker paid less, in the case of Panamax Bulkers to the tune of 3.2%.
Expenditure on crew costs was down 3.3% in the container ship sector. The biggest fall in crew costs in this category was the 3.6% reduction recorded for vessels of between 2,000 and 6,000 teu.
Expenditure on stores was down by 4.3% overall, compared to the fall of 2.4% in 2014. The biggest fall in such costs was the 8.5% recorded by operators of Capesize Bulkers, with Panamax Bulkers (8.2%) not far behind. For bulk carriers overall, stores costs fell by an average of 7.7%, compared to a fall of 3.7% in 2014, while in the tanker and container ship sectors the overall reductions in stores costs were 4.3% and 5.5% respectively, compared to the corresponding figures of 0.7% and 3.0% for 2014.
There was an overall fall in repairs and maintenance costs of 4.3%, compared to the 0.6% reduction recorded for 2014. Only VLCCs and Container Ships of between 1,000 and 2,000 teu recorded increased expenditure on repairs and maintenance, of 0.1% and 1.3% respectively. Otherwise it was a case of reduced spending everywhere.
The overall drop in costs of 3.2% recorded for insurance compares to the 0.4% fall recorded for 2014. No vessels in the bulker category paid more for their insurance in 2015 than in 2014. Handysize Bulkers paid considerably less (5.7%) as did Panamax Bulkers (5.3%). Product Tankers and Tankers of 5,000 to10,000 dwt were the only vessels in the tanker category to pay more for their insurance in 2015 than in the previous year, to the tune of 1.3% and 0.6% respectively. The biggest increase in insurance costs, however, was the 2.6% recorded by LPG carriers in the 10,000 to 40,000 cbm range.
The biggest cost reductions were predictably those in the Stores and Repairs and Maintenance categories. Falling world oil prices continued to have a knock-on effect on lube oil costs in 2015, while increasing numbers of owners were looking to strategic short-term lay-up rather than spending on maintenance and repair.
The fall in crew costs arguably came as more of a surprise to an industry which has over the years absorbed increases of this type in excess of 20%.
Taking Stock and a Look Ahead
Last year, operators were not overly optimistic about making new investments in the short-term, while finance costs were predicted to rise. Nobody was expecting good news on dry bulk freight rates, and the outlook for tanker and container ship earnings was little better. The Baltic Dry Index, meanwhile, was getting ready to plumb the depths. It was not an auspicious time to be planning new ventures; rather, it was a time for taking stock and for keeping operating costs to a minimum.
Shipping can draw comfort from a fourth successive annual fall in operating costs. But it should remember that costs can move both ways. OpCost records that, at year-end 2001, for example, the average daily operating cost for a Handymax Bulk Carrier was US$3,578. In 2015, it was US$ 5,604. For a Suezmax Tanker, the comparable figures are US$4,916 and US$9,170.
Looking further ahead, vessel operating costs are expected to rise by 1.9% in 2016 and by 2.5% in 2017. A Moore Stephens survey of future operating costs has revealed that the cost of repairs and maintenance is expected to increase by 1.7% in 2016 and by 1.9% in 2017, while expenditure on spares is predicted to rise by 1.7% in 2016 and by 1.8% in 2017. The cost of drydocking expenditure, meanwhile, is predicted to increase by 1.5% and 1.8% in 2016 and 2017 respectively.
The survey revealed that the outlay on crew wages is expected to increase by 1.3% in 2016, rising to 1.8% in 2017, with other crew costs thought likely to go up by 1.2% and 1.4% respectively for the years under review. The increase in outlay for lubricants is predicted to be 0.8% and 1.4% in 2016 and 2017 respectively, and that for stores 1.3% and 1.7%. Meanwhile, projected increases in management fees are 1.0% and 1.2% in the two years under review.
The cost of hull and machinery insurance is predicted to rise by 0.9% and 1.1% in 2016 and 2017 respectively, while for P&I insurance the projected increases are 1.1% and 1.2%.
The predicted overall cost increases for 2016 were highest in the container ship sector, where they averaged 3.3% against the overall survey increase of 1.9%. By way of contrast, predicted cost increases for 2016 in the offshore sector were just 0.2%. Container ships also headed the expected cost increases for 2017, at 3.4% compared to the overall survey average of 2.5%. Tankers featured in second place for both years at 2.5% for 2016 and 2.9% for 2017.
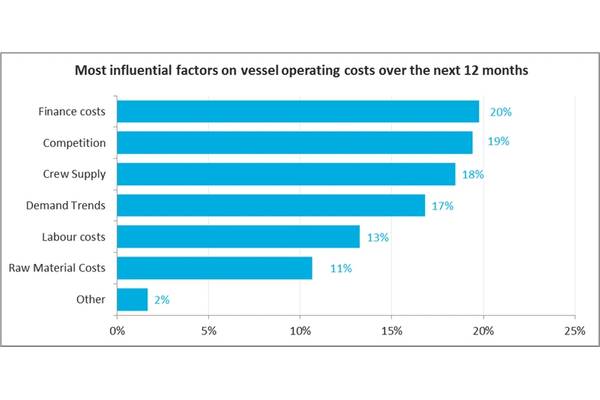
Meanwhile, 20% of respondents (compared to 22% in last year’s survey) identified finance costs as the most significant factor likely to affect operating costs over the next 12 months, followed by competition at 19% (down from 22% last time), and crew supply (18%).
Wild Cards & Warning Signs
While the level of predicted increases for this year and next will undoubtedly be the cause of some concern, it is instructive to note by way of example that the average operating cost increase absorbed by the industry in 2008 was no less than 16%. Meanwhile, one year ago, expectations of operating cost increases in 2016 were 2.8% on average.
The fact that repairs and maintenance costs headed the list of predicted cost increases in both 2016 and 2017 may be due to a number of factors, including the need to commit to repairs and maintenance deferred in earlier years, and the opportunity to do so at a time when the alternative could be to struggle to compete in a difficult economic and industry climate.
One highly influential factor behind the anticipated rise in drydocking costs, most notably in 2017, is the entry into force of the Ballast Water Management Convention in September 2017, before which date some owners may choose to put their ships into drydock to ready them for the new legislation.
The anticipated rise in crew wages and other crew costs, meanwhile, is arguably lower than anticipated, and there was indeed a feeling on the part of some respondents that wages could stabilize this year or even go down.
Shipping faces a number of potentially costly compliance responsibilities, including the imposition of a 0.5% global cap on sulphur emissions with effect from 2020. Other operating issues include predicted increases in the price of fuel, which will have a knock-on effect on lube oil costs.
Shipping is an industry with a guaranteed future, but just how healthy that future will be depends on its ability to generate sustainable profits after operating costs have been met.
The Author
Richard Greiner is a Moore Stephens Partner, in their Shipping & Transport group. He Richard has over 30 years experience in providing assurance and advisory services to the shipping and offshore maritime industries. A frequent speaker at shipping events, he is a council member of the Ports and Terminals Group, Maritime London and a trustee of the Maritime London Officer Cadet Scholarship.