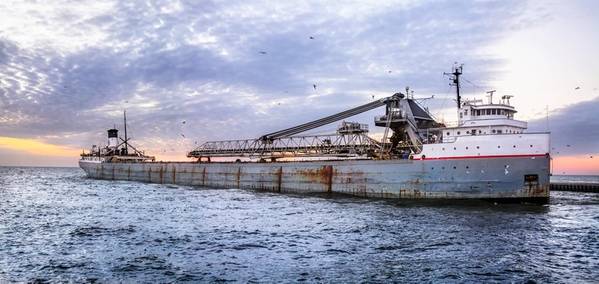
Shipments of iron ore on the Great Lakes and St. Lawrence Seaway totaled 5.5 million tons in April, a decrease of 6.3 percent compared to a year ago but nearly 15 percent ahead of the month’s five-year average, the Lake Carriers’ Association (LCA) reported.
Shipments from U.S. Great Lakes ports in April were down 4.5 percent at 5.1 million tons, LCA said. The mine that shipped through Escanaba, Mich. has been permanently idled, meaning all the iron ore shipped to U.S. steel mills in April had to transit the Poe Lock at Sault Ste. Marie, Mich. The MacArthur Lock is undergoing maintenance so has yet to open for this season.
Loadings at Canadian terminals in the Seaway totaled 380,000 tons in April, a decrease of 18.2 percent.
At 9.4 million tons, the year-to-date the iron ore trade is down 13.7 percent compared to the same point in 2017. Year-over-year, loadings at U.S. ports are down 15.6 percent at 8.2 million tons.
Meanwhile, Shipments from Canadian ports in the St. Lawrence Seaway have increased slightly to 1.2 million tons.
Iron Ore Shipments from Great Lakes and Seaway Ports to Great Lakes Destinations
Includes Transshipments to Quebec City for Shipment Overseas
April 2013-2018 and Long-Term Average (net tons)
| U.S. Great Lakes Ports | |||||||
| Port | 2013 | 2014 | 2015 | 2016 | 2017 | 2018 | Average 2013-2017 |
| Duluth, MN | 1,034,913 | 172,262 | 579,316 | 707,895 | 792,096 | 873,939 | 657,296 |
| Superior, WI | 881,485 | 288,686 | 675,646 | 1,062,329 | 1,121,954 | 1,096,469 | 806,020 |
| Two Harbors, MN | 1,533,917 | 440,462 | 1,158,696 | 1,621,255 | 1,622,011 | 1,450,134 | 1,275,268 |
| Silver Bay, MN | 525,084 | 87,177 | 383,847 | 0 | 583,001 | 593,178 | 315,822 |
| Presque Ise, MI | 630,811 | 144,932 | 390,416 | 823,281 | 617,451 | 638,010 | 521,378 |
| Escanaba, MI* | 89,340 | 772,625 | 416,359 | 432,117 | 237,780 | 0 | 389,644 |
| Cleveland, OH | 170,999 | 153,700 | 312,688 | 334,181 | 314,468 | 318,905 | 257,207 |
| Ashtabula, OH | 0 | 41,559 | 0 | 0 | 31,392 | 110,710 | 14,590 |
| Conneaut, OH | 0 | 31,966 | 0 | 0 | 0 | 0 | 6,393 |
| Total | 4,866,549 | 2,133,369 | 3,916,968 | 4,981,058 | 5,320,153 | 5,081,345 | 4,243,619 |
| Canadian Seaway Ports | |||||||
| Pointe Noire, QC | 87,031 | 0 | 0 | 0 | 0 | 0 | 17,406 |
| Port Cartier, QC | 459,399 | 452,476 | 424,080 | 368,172 | 464,618 | 380,227 | 433,749 |
| Sept Iles, QC | 147,541 | 150,847 | 0 | 6,625 | 42,218 | 0 | 69,446 |
| Total | 693,971 | 603,323 | 424,080 | 374,797 | 506,836 | 380,227 | 520,601 |
| Total - U.S., Canada | 5,560,520 | 2,736,692 | 4,341,048 | 5,355,855 | 5,826,989 | 5,461,572 | 4,764,221 |
* Dock ceased operations April 2017.
** Transshipments within Cleveland Harbor.


