The northbound East Coast South America to Europe trade is on the mend heading into the Brazilian fruit export season, says research and consulting firm Drewry.
The latest container statistics for the Europe-East Coast South America trade shows that the southbound market continues to strengthen, while the long-time downwards trend for the northbound trade has bottomed out and starting to turn the corner.
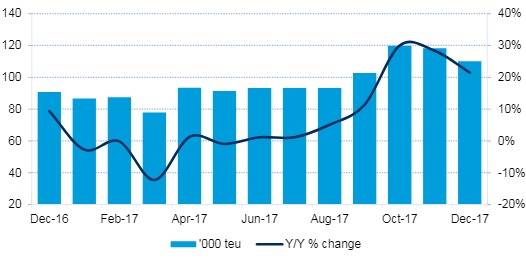
Figures from Datamar up to and including September reveal that southbound container volumes from Europe have performed very well, registering year-on-year gains in 13 consecutive months, with seven of those months rising by at least 10 percent, including the last two months. After nine months in 2017, the southbound trade was up by 12 percent compared to the same period last year and is on course to match the 2014 annual total after a couple of lean years. This will be the first year since 2013 with any type of annual growth.
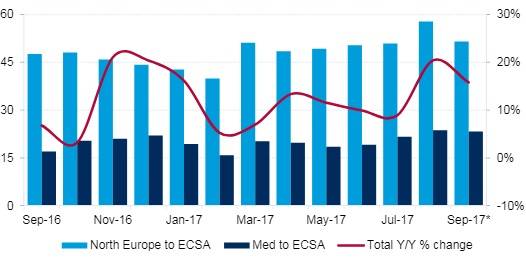
Split by region of export, growth from the smaller Mediterranean market was strongest, rising by 17 percent to 181,000 TEU after nine months. North Europe exports to ECSA increased by 10 percent to 442,000 TEU over the same timeframe.
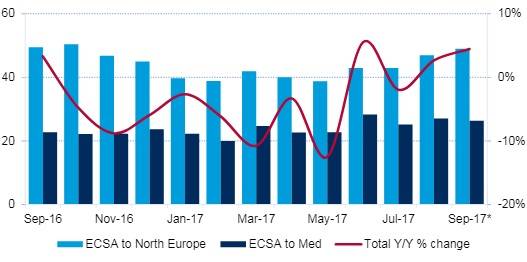
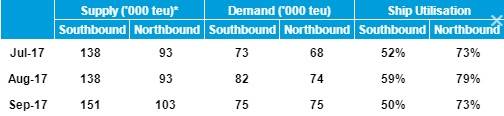
Shipments in the more reefer-oriented northbound trade have fared less well and outbound ECSA traffic was down by 3 percent after three quarters. However, trade has improved markedly since the second quarter, which was impacted by severe weather that shuttered the port of Itajai in south Brazil for around three weeks across May and June. Northbound volumes increased by 1.8 percent year-on-year in the third quarter, following three consecutive negative quarters.
Imports into Brazil have benefited from a fall in the country’s inflation rate, which recently decreased to a near 10-year low of about 4 percent, and from an appreciation of the real currency. A bumper soy bean crop this year, following a disastrous one the year before, is helping the country to climb out of recession, which in turn is giving some assurance to importers and consumers that the tide has turned.
By year-end, simply in terms of overall TEU the ECSA-Europe inbound and outbound trades very well may end up closely matched – something which it came close to doing in 2012.
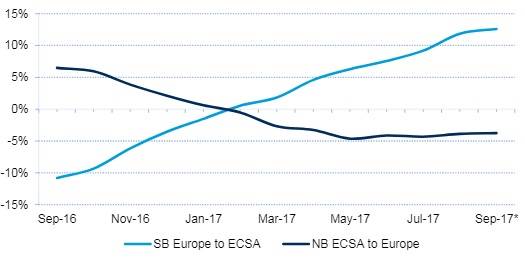
As the chart below on 12-month rolling averages shows the downwards spiral for the northbound trade appears to be over with the long-term trend bottoming out. We would expect things to improve further as Brazil is intent on boosting its fruit exports, up by about 4 percent so far this year. The country is the world’s third largest fruit producer, surpassed only by China and India, although Brazilian production currently amounts to a mere 1 percent of global fruit transactions.
It is this opportunity to tap into a market full of potential – and of course the attraction of high paying reefer cargo – that has prompted CMA CGM to launch its seasonal North Brazil Express (NBX) loop, with average vessel sizes of 1,750 TEU (including 500 TEU reefer slots). The French carrier will later this month add calls to London Gateway so that the service has a second North Europe call in addition to Rotterdam. To cater for the new port a fifth vessel will be assigned to the service.
In addition, Maersk Line will add its own seasonal reefer loop between November and February 2018 with the start of the Pecem Express serving Pecem, Algeciras, London Gateway, Rotterdam and Pecem again.
These are just two of a variety of service changes that have occurred recently in this route, which Drewry calculates will add an extra 30,000 TEU per month to the southbound market on average during the final quarter, and 20,000 TEU each month northbound.
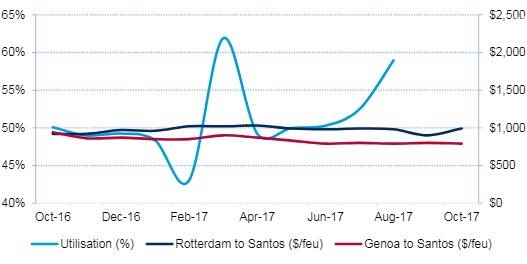
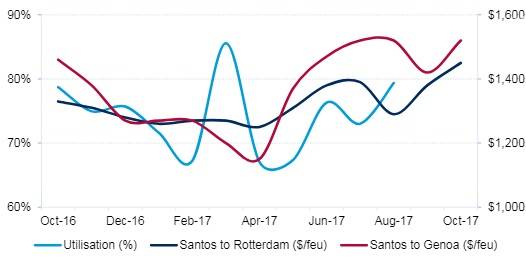
The additional capacity in the market has not done much to change southbound spot rates, which have stubbornly refused to budge from about $1,000 per 40 foot container all year, according to Drewry’s Container Freight Rate Insight. Stronger ship utilization in recent months has supported gains of about $100 per 40ft in the more volatile northbound sector.
The demand outlook for the northbound trade is much brighter, which will support further spot rate increases during the fruit export season.
(Source: Drewry Container Insight Weekly)