The way carriers calculate bunker surcharges is often disputed by shippers, and no more so than now. Drewry Maritime Research explains.
Bunker surcharges should, proportionately, have been reducing faster than fuel prices because of the deployment of more efficient ships, but this does not appear to have happened for most carriers. The issue is highlighted by two recent developments in the container industry. Firstly, the arrival of Maersk’s first 18,000 teu vessels, and secondly, the availability of really cheap fuel in Russian ports again.
As explained in ‘Why size matters’ (http://ciw.drewry.co.uk/features/why-size-matters/#.Ui8TuL5wbiw), 18,000 teu vessels burn approximately 35% less fuel per teu carried on a round voyage basis between Asia and Northern Europe than 13,100 teu vessels ($218/teu versus $333/teu), and 13,100 teu vessels burn 20% less than a 9,000 teu vessels ($333/teu versus $415/teu), assuming constant speeds of 20 knots westbound and 14.6 knots eastbound, and that the bigger vessels will be less full. In turn, 9,000 teu vessels burn approximately 23% less than 6,000 teu vessels ($415/teu versus $542/teu).
The pace of change has been gathering momentum. In 3Q 11, the average size of vessel deployed between Asia and Northern Europe was just 9,158 teu, which increased by 8% in the next twelve months, up to 9,881 teu, and by another 9% in the next twelve months, up to over 10,800 teu. The change in the transpacific was slightly less, being 7% between 3Q 11 and 3Q 12, up to 6,264 teu, but only 1% between 3Q 12 and 3Q 13, up to 6,320 teu.
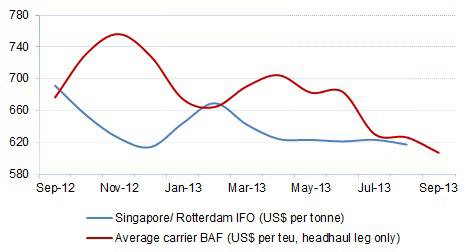
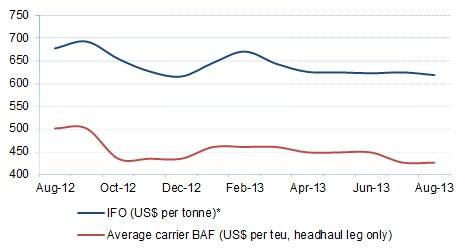
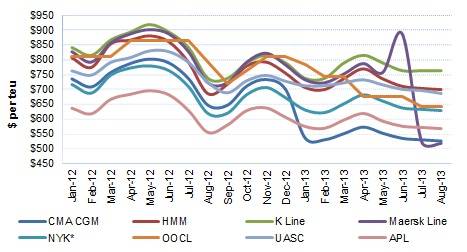
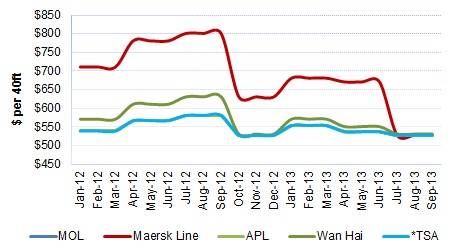
This means that bunker surcharge levels should have been falling faster than fuel prices since 3Q 12, which is not immediately apparent from Figures below – except for Maersk Line, due to the dramatic revision of its Standard Bunker Adjustment Factor (SBF) formula on 4 June, 2013, which explains why overall averages have subsequently dropped.
For more information, Email: [email protected]