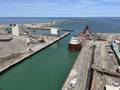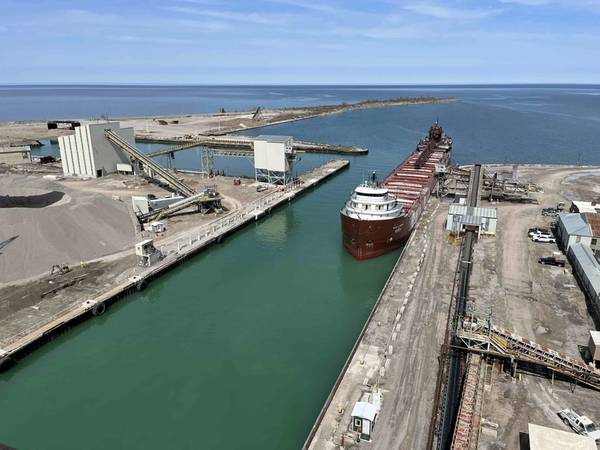
U.S. shipments of limestone on the Great Lakes decreased 7.8 percent from 2025 to 2.95 million tons. Limestone cargos were below the month’s 5-year average by 17.3 percent.
Year-to-date, the limestone trade stands at 18.8 million tons, a decrease of 17.7 percent compared to last year and 22.4 percent below the month’s 5-year average.
GREAT LAKES LIMESTONE TRADE: OCTOBER 2021-2026 AND LONG-TERM AVERAGE
(NET TONS)
| 2021 | 2022 | 2023 | 2024 | 2025 | 2026 | Average |
U.S. Ports | 2,915,616 | 3,197,709 | 2,992,462 | 2,740,218 | 2,573,839 | 2,951,990 | 2,883,969 |
Canadian Ports | 638,517 | 736,157 | 835,201 | 587,069 | 626,805 | NA** | 684,750 |
Total | 3,554,133 | 3,933,866 | 3,827,663 | 3,327,287 | 3,200,644 | 2,951,990 | 3,568,719 |
YEAR-TO-DATE 2021-2026 AND LONG-TERM AVERAGE
(NET TONS)
| 2021 | 2022 | 2023* | 2024 | 2025 | 2026 | Average |
U.S. Ports | 19,447,386 | 19,867,668 | 19,401,470 | 19,477,391 | 18,601,030 | 18,770,047 | 19,358,989 |
Canadian Ports | 5,193,170 | 5,137,804 | 4,886,669 | 4,672,909 | 4,208,832 | NA** | 4,819,877 |
Total | 24,640,556 | 25,005,472 | 24,288,139 | 24,150,300 | 22,809,862 | 18,770,047 | 24,178,866 |
*Revised 7/11/24
U.S. ports: Calcite, MI; Cedarville, MI; Drummond Island, MI; Marblehead, OH; Port Inland, MI; and Presque Isle, MI. Canadian ports: Bruce Mines, Manitoulin Island, Port Colborne (from August 2017 on), and Smelter Bay (all Ontario).
**As of April 2026, Canadian ports are no longer supplying information on limestone shipments.